13 JANUARY 2015
 Summary: Again, as so many times since 2000, oil prices dominate the news and shake the financial system. As usual, the news mixes fact and conjecture, wisdom and nonsense. Here’s an introduction to the basic facts, and a strong forecast about the future of oil prices.
Oil is the most economically sensitive of the industrial minerals, for many reasons (e.g., it’s easier to throw tons of copper into a warehouse than tons of oil). But Dr. Copper also signals a slowing global economy. During the past year the price of copper (green line) has dropped 20% while oil (WTI, black line) has fallen 50%. Commodity prices don’t provide a crystal ball’s vision of the future, but their movements deserve attention. {Update: Copper is catching up. Spot now down 36% from June peak.}
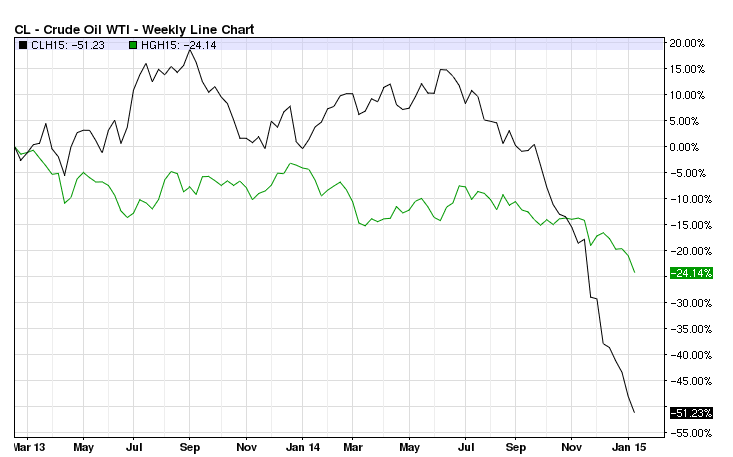
March 2015 futures: NYMEX Oil vs COMEX Copper. From CommodityCharts.com
This chart below gives even worse news for North American exploration and production companies (E&Ps) : natural gas prices have crashed from $4+ to $2.90 (not so large a drop as oil, but horrific on top of the oil crash). For context: oil is ~20% of US primary energy production (BTU), natural gas is ~30% (EIA data). Natural gas is bigger than oil.
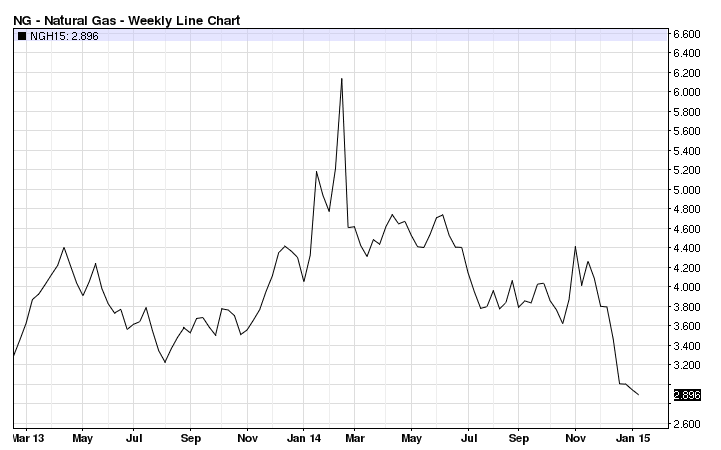
March 2015 NYMEX Natural Gas futures. From CommodityCharts.com
At $90 oil the E&P’s had good profit margins; at $4 natural gas they stayed afloat (with increasing debt levels). The combination of low and falling oil AND natural gas prices puts weaker E&Ps (i.e., with low margins and high debt levels) on the fast track to bankruptcy. Everybody has begun cutting costs — layoffs, pressuring suppliers for lower prices, reducing capex, etc. The pain in the oil patch has just begun.
Lower prices are good for the rest of us, providing a net benefit to America since we import so much (it’s purely good for Japan and the bad for the Gulf States). But a crash in such a large sector will offset much of the gains. Context: US oil & gas exploration and extraction provides 1.5% of non-farm employment, and produces less than 1% of GDP (value-added).
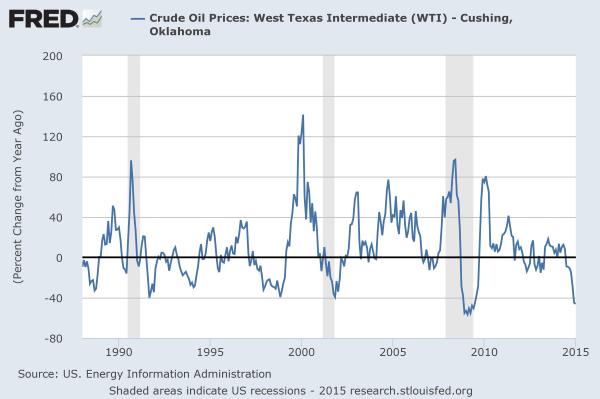
(2) How big are these moves?
Very large for oil; big for natural gas. See the year-over-year percent changes (the natural gas data only goes thru December 18, so does not show the current drop).
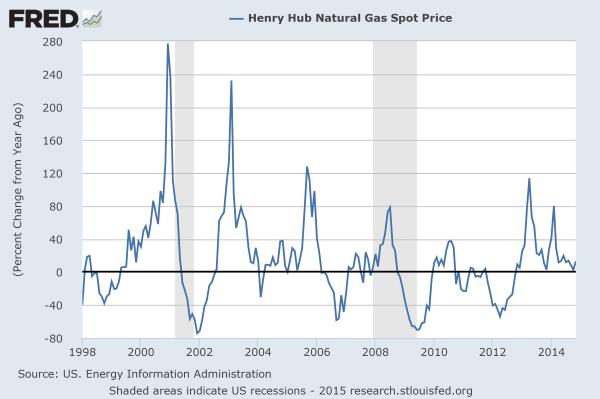
(3) Explanations for these moves.
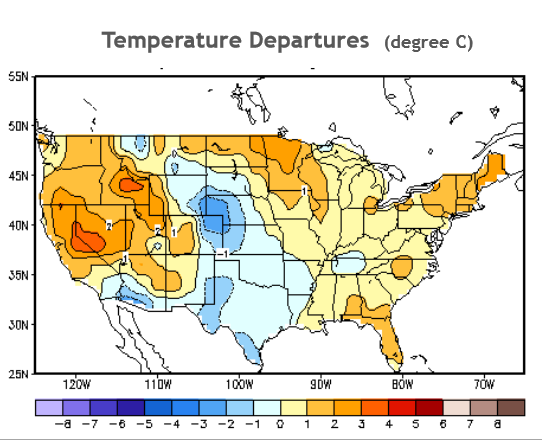
Weather has driven natural gas prices down. Strong production, warm weather in the densely populated northern states, and more warmth expected.
Oil price dynamics are more complex. High oil prices have worked their magic (which in 2005 the peak oil alarmists declared impossible), spurring increased production from a wide range of high-cost sources — notably mining of bitumen (“oil sands”) in Alberta and fracking in the US. Today’s low prices make much of this unprofitable. What’s forcing down prices? In finance, like love, “why” is the most difficult of questions.
The “ticker tape” gives the price and quantity for every trade; it doesn’t tell the reasons of either buyers or sellers. Has falling demand in the emerging nations crashed prices (we know demand in the developed nations has not fallen enough to cause the change)? That also would explain the fall in copper prices. Has increased supply tipped the balance? See the most recent EIA report on world oil production. It’s quite stable; no evidence that production caused prices to crash.
Is there a conspiracy at work? We read what representatives of the major national oil producers (e.g., the Saudi Princes) say about their actions and plans. Regard these as you would the words of a poker player about his cards and betting strategy. Instead watch their actions.
The OPEC nations — and especially the Saudi Princes — have often acted as the swing producers, throttling their production up or down to keep oil prices roughly stable. The price of WTI oil has been above $80 for five years, with everybody running their wells wide open. Now prices have gone into free fall. We can only guess at the calculations of the OPEC nations behind their decision not to cut production. Driving out competitive producers, many of whom have high production costs? Political action against Iran or/and Russia? Experts confidently guess about these things. There are only a few thousand people who know, and they don’t share their plans with us. I’m confident they have a strategy.
Much of the chatter about the implications of falling prices results from misunderstanding production costs and confusion about time scales.
Production costs consists of capital costs (aka sunk costs, money spent in the past), operating costs (aka current spending to get petroleum products out of the ground), overhead (cost of running the company), and profits. Journalists tend to focus on operating costs. Depending on the field, that might be the smallest component. Also important is well life, the production curve over time), the time over which the up-front costs are recovered. Fracked wells have the shortest effective life, followed by deep-sea wells (pumped out fast to recover the large capital costs).
Different fields have different mixes of costs. Over time we tap ever-lower quality fields, so both capital and operating costs tend to increase (see the explanation here), offset by new technology which sometimes lowers costs. So the spread of cost structures tends to widen between older legacy producers (the Gulf Princes being the largest) and the next-gen sources providing growth. A temporary surplus of production over consumption can allow legacy producers to bankrupt the next-gen producers (especially those who borrowed much of their capital costs).
These cycles evolve in complex ways over time. Falling prices have immediate effects.
(a) Positive feedbacks push oil prices down even more, as producers respond to falling revenue by increasing production. It’s logical for an individual, but disastrous for the collective industry — the commonplace behavior that produces business cycles. People from cartels like OPEC to prevent this.
(b) Ps can “high grade” their output by focusing on their most productive reserves. This robs Peter to pay Paul, leaving lower-quality fields for future use. But it keeps the cash flowing.
(c) Companies cut costs to minimize different kinds of red ink. Losses can violate loan covenants, resulting in catastrophic loss of bank credit. Negative cash flow produces more immediate pain. As cash reserves are exhausted, companies must borrow to stay alive. Lenders don’t like companies bleeding cash with low cash reserves, so the terms can be severe — or credit unavailable (i.e., leading to bankruptcy). That means reducing wages and forcing vendors to cut prices (the old adage says “prices drive costs, not vice versa”).
(d) Companies slash capex. This saves cash and has no immediate effect on production, but can lead to cliff-like falls in future output. That’s especially true when fracking, as output per well drops rapidly after one year (like the Red Queen, drillers must run as fast as possible just to maintain production). It’s already happening: “Oil projects worth billions put on hold“, Financial Times, 14 January 2015.
(d) E&P’s cut prospecting and acquisition of new properties. If low prices continue, even the giants will do so by lowering their price forecasts so that fewer prospects qualify for development.
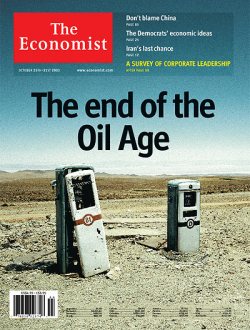
23 October 2003 in The Economist, as oil prices just began their long ascent
The net effect maintains or even increases currentproduction.
Then come defaults on loans, followed by bankruptcy. This doesn’t necessarily reduce production. Although unprofitable fields are abandoned, usually the new company has a lower cost structure (no loans, written-down of sunk costs, plus give-backs from workers and vendors) and can continue pumping. But defaults increase the cost of capital to the industry (reducing investment in capex even more).The banks and investment bankers will get dinged too.
 The big long-term result is less capex and hence lower futureoutput, but that takes time to appear. Natural gas has faster cycles than oil; we’ll probably see effects next year of current capex cuts.
Governments have less difficulty borrowing, and so have more options during a bust. The big rich oil producing nations can drive their competitors into the ground. Or they can throttle back production, immediately cutting their income even more but eventually ending the price bust. Reliably predicting such decisions I leave to the more competent and confident. One or the other will happen, eventually.
The rest of us — consumers, people in the oil industry, and the small oil producing nations — are along for the ride. It might prove painful for some.
See the next post for part 5 — The bottom line: oil prices will rise again. — and part 6 — When should we begin to prepare for peak oil?
For More Information
See the most recent EIA report on world oil production. It’s quite stable; no evidence that production caused prices to crash. Another important report is the World Bank’s January 2015 report “Understanding the Plunge in Oil Prices:Sources and Implications“.
All posts about oil:
Peak Oil and Energy – posts on the FM site – Articles discussing all these issues in detail
Peak oil and energy – Studies and reports, with links to authoritative outside sources
Some posts about oil relevant today:
When will global oil production peak? Here is the answer!, 1 November 2007
The three forms of Peak Oil (let’s hope for the benign form) , 23 April 2008
No comments:
Post a Comment